Service Logging
Your running service is returning 500s and you have no idea why. This is why all services need proper logging and those logs should be easily accessible. You need some kind of insight into that service running on that remote machine. Every programming language has some kind of popular logging library that allows the service to output messages at different log levels (such as DEBUG, INFO, ERROR). These libraries can also be configured to output the messages to different destinations such as rotating log files, remote services, or just plain old stdout.
For traditional services running on VMs, I prefer to output my logs to the operating system’s native logging system: syslog on Linux and the Event Viewer Application Log on Windows. This gets all logs in one place on the machine and we can use the OS’s logging systems built in features for purging/rotating log files.
Then from there we can use a separate process to ship these logs to our log aggregation system of choice.
Once you have a bunch of services running on many remote machines you probably don’t have direct access to, shipping these logs to a central location becomes important. This allows you to look in one known location for all logs and search them for the information you are looking for. I prefer the pattern of having apps log to the native OS facility which is pretty much always guaranteed to work and doesn’t require any special libraries to be added to the app. Then on the machine install a program that ships the logs to your log aggregator or choice. This also makes logging asynchronous so if the log aggregator is down or slow, the app doesn’t start throwing exceptions or slowing down. This pattern creates a true separation of concerns.
Most Kubernetes hosted cloud services have some default way of shipping and aggregating Kubernetes service logs. However, when running Kubernetes on premise you are probably going to have to roll your own. But luckily there are plenty of open source projects out there to fill this need.
Kubernetes Logging
By default, Kubernetes pipes the stdout of each running container to a log file in /var/log/containers. Each container gets its own log file in that directory. The log filenames are formatted kubernetes-pod-id_kubernetes-namespace_docker-container-id.log and the contents are in the default Docker json file logging format:
{"log":"Log line is here\n","stream":"stdout","time":"2019-01-01T11:11:11.111111111Z"}
...
So, the easiest way to integrate an application’s logs into Kubernetes is to just change the logging library to output its logs to stdout. One of the nice things about Kubernetes is it doesn’t force your application to be changed to include a bunch of Kubernetes specific libraries or constructs. Logging to stdout is probably the oldest and most basic method of logging for an application and all the logging libraries support it.
Windows IIS Service Logging
We have a large amount of existing C# .NETFramework based services that run in IIS on VMs. Our ultimate goal is to get all of these running on Windows Kubernetes as the effort to move them to .NET Core running on Linux would be too high (or impossible in some cases). The IIS docker container images write the web logs (URLs, HTTP response, etc…) t0 files in C:\inetpub\logs\LogFiles\W3SVC1 and our typical IIS services log to the Windows application log. If we can get those logs to stdout then we will be in a position to leverage the Kubernetes logging infrastructure.
LogMonitor
Luckily Microsoft has written a tool called LogMonitor that will take both the Windows event logs and the IIS log files and stream them to stdout for us. I tried to run this in as a generic sidecar container to my pod but wasn’t able to figure out how to get access to the other containers event logs. So to make things work I just include the LogMonitor.exe and sample LogMonitorConfig.json in a LogMonitor directory in my repo then place those in my docker image build.
COPY LogMonitor/. /LogMonitor/
The way LogMonitor.exe works, it runs and starts streaming the configured logs to stdout and it also launches the command line for the app you want to run in your pod. So the end of our Dockerfile ends up looking like this to start logging and run IIS:
# Use LogMonitor to push event and IIS logs to console
WORKDIR /LogMonitor
SHELL ["C:\\LogMonitor\\LogMonitor.exe", "powershell.exe"]

# Start IIS Remote Management and monitor IIS
ENTRYPOINT      C:\ServiceMonitor.exe w3svc
With those simple Dockerfile changes we now have all of our IIS and Windows Application logs being output to stdout which is then written to the container’s log file in /var/log/containers.
Log Aggregation with ElasticSearch
Fluentd is incredibly flexible as to where it ships the logs for aggregation. You can ship to a number of different popular cloud providers or various data stores such as flat files, Kafka, ElasticSearch, etc…. In our on premise setup we have already setup ElasticSearch on a dedicated VM. In our case we actually installed docker on a VM and then ran a simple docker compose file to bring up an entire ELK stack (ElasticSearch, LogStash, Kibana). If you have persistent storage in your Kubernetes cluster you can also easily bring up ElasticSearch in your cluster as well via standard Helm charts.
All of our servers either log directly to ElasticSearch (using LogStash) or we configure rsyslog to forward logs to the LogStash service running our ELK stack machine. That logstash service then parses the syslogs and places the data in ElasticSearch. We then use some custom ElasticSearch curl calls for generating alerts on specific metrics/events. We use Kibana for all ad-hoc viewing/searching of logs. This simple setup handles over 25 million log entries a day for us.
Log Shipping with Fluentd
Now that we have logs and a place to put them, we need to figure out a way to transfer them. There are a number of projects built specifically for the task of streaming logs of different formats to various destinations. For our Linux nodes we actually use Fluent Bit to stream Kubernetes container logs to ElasticSearch. It is lightweight and does everything we need to ship Kubernetes container logs with Kubernetes metadata to ElasticSearch. However Fluent Bit is still changing day to day to try and successfully support running on Windows. It just isn’t ready yet.
So I decided to use its big brother Fluentd instead. It is more flexible than Fluent Bit and has better support for running on Windows. Fluentd builds a docker image for Windows but it is tied to Windows server version 1903 and I am using 1809. So I brought down the Fluentd Dockerfile and modified the first line to say:
FROM mcr.microsoft.com/windows/servercore:1809
I also used the following fluent.conf file to parse Kubernetes container logs and ship them to ElasticSearch with Kubernetes metadata added to each log entry:
<match fluent.**>
  @type null
</match>
#Target Logs (ex:nginx)
<source>
  @type tail
  @id in_tail_container_logs
  path /var/log/containers/*.log
  pos_file /var/log/containers/fluentd-containers.log.pos
  tag kubernetes.*
  read_from_head true
  format json
  time_format %Y-%m-%dT%H:%M:%S.%N%Z
</source>
<filter kubernetes.**>
  @type kubernetes_metadata
  @id filter_kube_metadata
</filter>
<filter kubernetes.**>
  @type grep
  <exclude>
    key log
    pattern /Reply/
  </exclude>
</filter>
<match kubernetes.**>
    @type elasticsearch
    @id out_es
    @log_level info
    include_tag_key true
    host "#{ENV['FLUENT_ELASTICSEARCH_HOST']}"
    port "#{ENV['FLUENT_ELASTICSEARCH_PORT']}"
    scheme "#{ENV['FLUENT_ELASTICSEARCH_SCHEME'] || 'http'}"
    ssl_verify "#{ENV['FLUENT_ELASTICSEARCH_SSL_VERIFY'] || 'false'}"
    #user "#{ENV['FLUENT_ELASTICSEARCH_USER']}"
    #password "#{ENV['FLUENT_ELASTICSEARCH_PASSWORD']}"
    reload_connections "#{ENV['FLUENT_ELASTICSEARCH_RELOAD_CONNECTIONS'] || 'true'}"
    logstash_prefix "#{ENV['FLUENT_ELASTICSEARCH_LOGSTASH_PREFIX'] || 'eventlog'}"
    logstash_format true
    type_name fluentd
    <buffer>
      flush_thread_count "#{ENV['FLUENT_ELASTICSEARCH_BUFFER_FLUSH_THREAD_COUNT'] || '8'}"
      flush_interval "#{ENV['FLUENT_ELASTICSEARCH_BUFFER_FLUSH_INTERVAL'] || '5s'}"
      chunk_limit_size "#{ENV['FLUENT_ELASTICSEARCH_BUFFER_CHUNK_LIMIT_SIZE'] || '2M'}"
      queue_limit_length "#{ENV['FLUENT_ELASTICSEARCH_BUFFER_QUEUE_LIMIT_LENGTH'] || '32'}"
      retry_max_interval "#{ENV['FLUENT_ELASTICSEARCH_BUFFER_RETRY_MAX_INTERVAL'] || '30'}"
      retry_forever true
    </buffer>
</match>
I then built that docker image and pushed up to our private docker registry.
Next is getting this running on our Windows Kubernetes hosts. The easiest way to do this is by adding a DaemonSet to Kubernetes. This means a single instance of this container is run on every node in the cluster. However this is a Windows image so we only want it running on our Windows nodes. In our cluster, we taint all of our Windows nodes so we can easily install Linux based Kubernetes projects and helm charts without having to force in nodeSelector statements everywhere. Since there aren’t many open source Windows Kubernetes projects out there and most of what we run on our Windows nodes is our own software it isn’t a big deal in those instances to add the appropriate node toleration and selector options to keep them on the Windows nodes. So we do that in our DaemonSet definition.
One things that threw me for a loop was the location of the container logs on the Windows machines. The Windows hosts have a /var/log/containers directory but it contains symlinks to other locations. If you double click the symlink in Explorer it doesn’t open so I thought they were bad. I finally found the real files in c:\ProgramData\docker\containers. However the logs are in subdirectories and the filenames are different than those in /var/log/containers. It turns out the Kubernetes filter in fluentd expects the /var/log/containters filename convention in order to add Kubernetes metadata to the log entries.
It turns out the symlinks work if you try and output them from Powershell. The /var/log/containers symlink points to a file under a directory in /var/log/pods which is another symlink that points to the real location in c:\ProgramData\docker\containers. So in order to get the single instance of Fluentd running on each host to be able to see all the log data we need to mount volumes that include all those locations. So I ended up mounting /var/log (giving Fluentd access to both the symlinks in both the containers and pods subdirectories) and c:\ProgramData\docker\containers (where the real logs live).
Here is the Kuebernetes YAML files for running Fluentd as a DaemonSet on Windows with the appropriate permissions to get the Kubernetes metadata.
---
apiVersion: v1
kind: ServiceAccount
metadata:
  name: fluentd
  namespace: monitoring
---
apiVersion: rbac.authorization.k8s.io/v1beta1
kind: ClusterRole
metadata:
  name: fluentd
  namespace: monitoring
rules:
- apiGroups:
  - ""
  resources:
  - pods
  - namespaces
  verbs:
  - get
  - list
  - watch
---
kind: ClusterRoleBinding
apiVersion: rbac.authorization.k8s.io/v1beta1
metadata:
  name: fluentd
roleRef:
  kind: ClusterRole
  name: fluentd
  apiGroup: rbac.authorization.k8s.io
subjects:
- kind: ServiceAccount
  name: fluentd
  namespace: monitoring
---
apiVersion: apps/v1
kind: DaemonSet
metadata:
  name: fluentd-windows
  namespace: monitoring
  labels:
    k8s-app: fluentd-windows-logging
    version: v1
spec:
  selector:
    matchLabels:
      k8s-app: fluentd-windows-logging
      version: v1
  template:
    metadata:
      labels:
        k8s-app: fluentd-windows-logging
        version: v1
    spec:
      serviceAccount: fluentd
      serviceAccountName: fluentd
      nodeSelector:
        kubernetes.io/os: windows
      tolerations:
      - key: "os"
        operator: "Equal"
        value: "Win1809"
        effect: "NoSchedule"
      containers:
      - name: fluentd
        image: fluentd:1.8.1
        env:
          - name:  FLUENT_ELASTICSEARCH_HOST
            value: "elk"
          - name:  FLUENT_ELASTICSEARCH_PORT
            value: "9200"
          - name: FLUENT_ELASTICSEARCH_SCHEME
            value: "http"
          - name: FLUENT_ELASTICSEARCH_SSL_VERIFY
            value: "false"
          - name: FLUENT_ELASTICSEARCH_SSL_VERSION
            value: "TLSv1_2"
          # X-Pack Authentication
          # =====================
          #- name: FLUENT_ELASTICSEARCH_USER
          #  value: "elastic"
          #- name: FLUENT_ELASTICSEARCH_PASSWORD
          #  value: "changeme"
        resources:
          limits:
            memory: 500Mi
          requests:
            cpu: 100m
            memory: 200Mi
        # On Windows the kubernetes container logs with the
        # filename format fluentd Kubernetes plugin expects
        # are in /var/log/containers which is a symlink to
        # files in dires under /var/log/docker which are
        # symlkinks to files and dirs in
        # c:\ProgramData\docker\containers. So we need to map
        # all those volumes so the symlinks and their references
        # can all be accessed.
        volumeMounts:
        - name: varlog
          mountPath: /var/log
        - name: progdatacontainers
          mountPath: /ProgramData/docker/containers
      terminationGracePeriodSeconds: 30
      volumes:
      - name: varlog
        hostPath:
          path: /var/log
      - name: progdatacontainers
        hostPath:
          path: /ProgramData/docker/containers
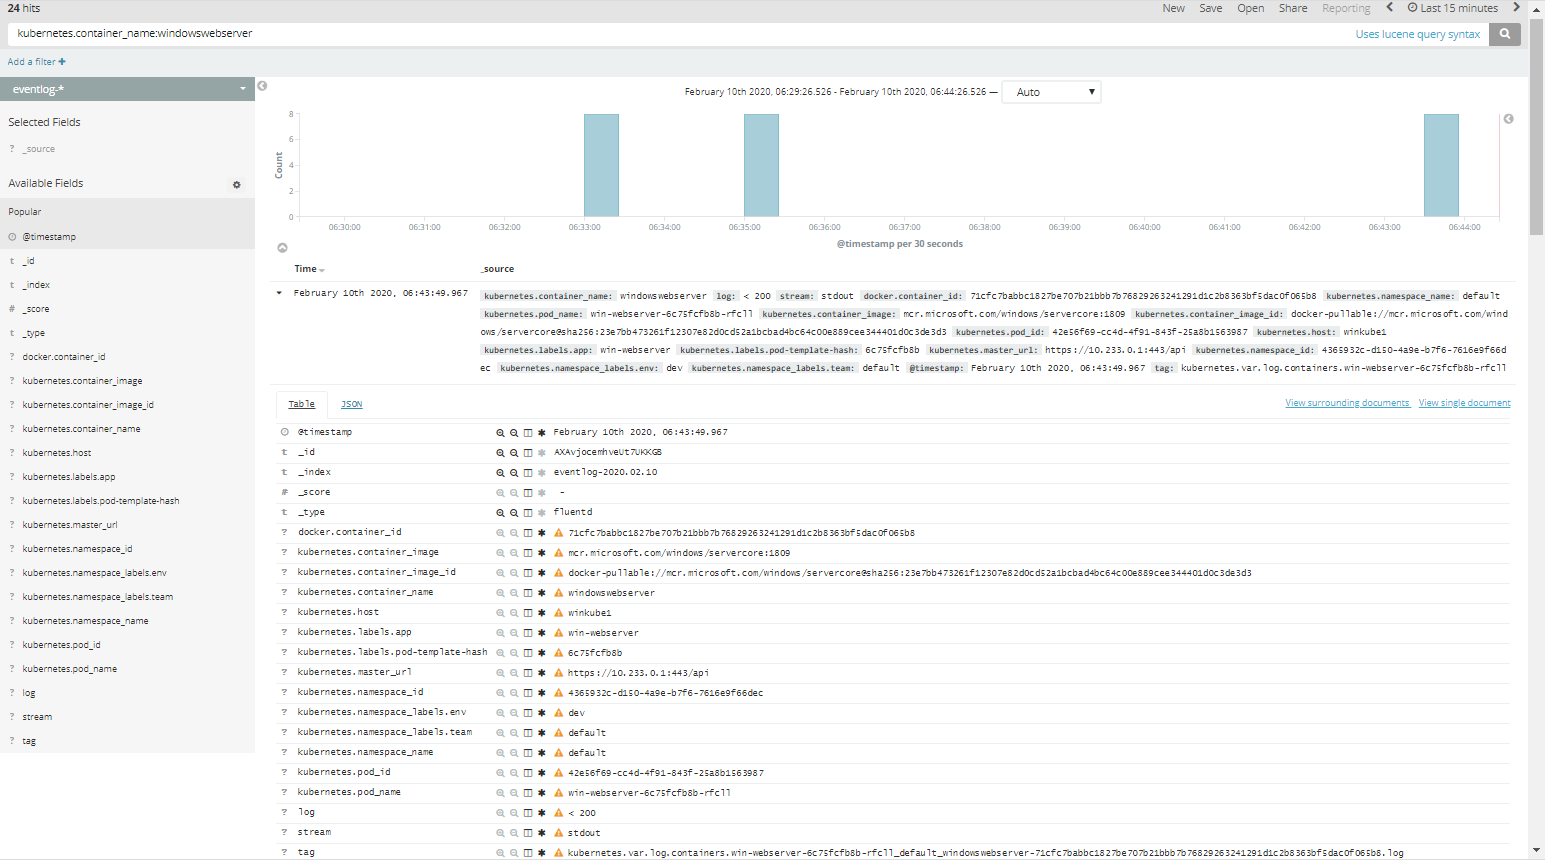
Log Searching
Now that we have our containers logs going to ElasticSearch we can easily search for them using Kibana. Not only can we see and search in the
log value that has been inserted into ElasticSearch, but we can also see and search in the Kubernetes metadata that the Fluentd Kubernetes
filter has added to the data. Fields such as kubernetes.container_name,
the various kubernetes.labels..., kubernetes.namespace_name,
kubernetes.host, and kubernetes.pod_name. With these fields we can quickly figure out or find which pods are logging what messages.
For example, in Kibana we can search for kubernetes.container_name:windowswebserver and it will show us all of our logs for our pods named “windowswebserver”.
Conclusion
At this point we finally have all our Windows container logs being shipped to ElasticSearch with the various Kubernetes metadata we would be interested in, all using standard open source projects. Once you know what needs to be done it’s all pretty easy to put together with minimal changes to your existing Windows services.